
Beyond Bonds:
Are Gulf-Region Sukuk the Ultimate Asset Allocation Tools?
Download a PDF:

A little-known market niche is evolving into one of the best kept secrets in asset allocation. Sharia-compliant investment certificates, referred to as sukuk, provide portfolio diversification, investment income, and capital preservation characteristics similar to bonds. Gulf Cooperation Council (GCC) debt and sukuk provide investors meaningful yield enhancement as an appealing alternative to equities and conventional bonds. Here we cover the risk and return attributes of sukuk and explore their relationship to changes in the price of oil; an important point to consider since hydrocarbons largely drive GCC sukuk issuers' economies. Our scope is limited to US-dollar denominated sukuk, primarily originating from members of the Gulf Cooperation Council (GCC), a collective coalition comprised of six member states in the Middle East.
US-dollar denominated sukuk from the Gulf Cooperation Council (GCC):
- Generally high investment-grade and higher yielding than some lower rated debt
- Performance tied to underlying tangible assets, helping to insulate from short-term oil price shocks
- Low-debt GCC issuers have "plenty in the bank and plenty in the tank"
- Favorable relative risk profile
Our rationale for focusing attention on the US-dollar denominated GCC sukuk market rather than the global sukuk market is that there is little research in this area, yet the region continues to lead other regions in issuance of US-dollar denominated sukuk. At year-end 2019, the GCC region represented 69% of the total $28.6 billion of sukuk issued. Supranational banks represent 13% of issuance, and Turkey follows at 8%. At year-end 2018, US-dollar denominated sukuk represented 25.4%1 of total sukuk issuance, estimated to be valued at $490.7 billion.2
Scroll right to see more »
US Dollar Denominated Sukuk Issuance Trends (2015-2019) | |||||
| Region of Issuance | 2015 | 2016 | 2017 | 2018 | 2019 |
| GCC | 54% | 43% | 67% | 69% | 69% |
| Malaysia | 19% | 16% | 0% | 4% | 2% |
| Indonesia | 4% | 11% | 11% | 12% | 7% |
| Turkey | 2% | 8% | 5% | 1% | 8% |
| Supranational | 5% | 15% | 11% | 12% | 13% |
| Other | 16% | 7% | 7% | 1% | 1% |
| Total USD Issued (In $ Billion) | $12,033 | $22,890 | $28,158 | $25,119 | $28,627 |
| Source: Bloomberg, Saturna Capital research | |||||
Scroll right to see more »
What's oil got to do with it?
Broadly speaking, GCC members were not active issuers of either debt or sukuk until 2016. Following the collapse of oil prices from 2014 to 2016, GCC members turned to capital markets as a means to supplement government funding gaps. During that time, the price of oil dropped -75.6% from a high of $107.26 per barrel on June 20, 2014, to a low of $26.21 on February 11, 2015. For the next 15 months until October 6, 2016, the GCC members would not see the price of oil rise above $50.00 per barrel.
Oil's rapid and pronounced decline placed each of the GCC members in a difficult fiscal position. To offset the decline in hydrocarbon revenues, they began drawing down their regional pools of savings, such as sovereign wealth funds, to offset fiscal shortfalls. Government leaders soon realized they needed an alternative solution as it became clear that solely drawing upon their sovereign wealth funds wasn't going to offer them a long-term solution. Analysts' forecast it was entirely plausible that Saudi Arabia would burn through its entire sovereign wealth fund in a matter of years if oil remained below $40 a barrel 2017.3
In April of 2016, Abu Dhabi issued a $5 billion bond to help offset a projected $10 billion deficit. It was the emirate's first bond sale in seven years since selling $1.5 billion in April 2009.4,5 Strong demand for Abu Dhabi's high investment-grade bond (AA) bond caused it to be oversubscribed. Investors placed over 600 orders in excess of $17 billion.6 GCC members took notice of Abu Dhabi's success. This marked the onset of a new era as the region looked to external investors to help offset budgetary shortfalls. Later, GCC members looked to these investors as a primary source to fund other capital development and infrastructure projects.
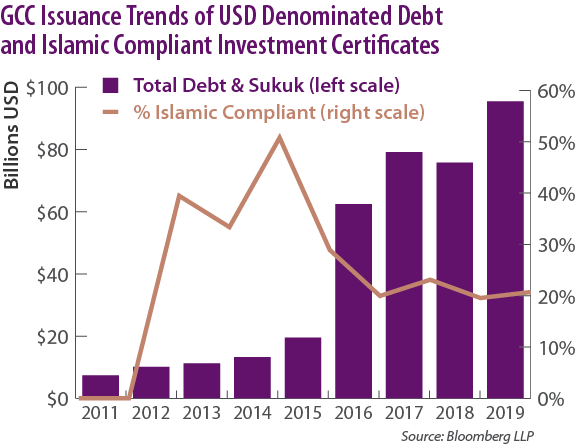
In recent years the GCC region has evolved to become an active issuer of both conventional debt and sukuk. The GCC region issued $95.4 billion in conventional debt and sharia-compliant investment securities in 2019, an increase of 25.9% from the prior year's issuance of $75.7 billion and reflecting a three-year compound annual growth rate (CAGR) of 15.2%. Over the last four years, sharia-compliant securities have averaged 20.8% of total issuance.
What is the GCC?
The GCC is an acronym for the Gulf Cooperation Council, a political and economic alliance of six countries in the Arabian Peninsula. Its members include Bahrain, Kuwait, Oman, Qatar, Saudi Arabia, and the United Arab Emirates (UAE). The GCC was established in 1981 to promote security and stability for its members5 and has an estimated population of 54 million.6 At year-end 2019, the estimated total GDP of GCC nations was $1.63 trillion, about 7.6% of the United States' GDP by comparison.7
What's the Appeal for Investors?
GCC-issued debt and sukuk have several important and appealing attributes that attract investors. One of the alluring characteristics of the region is the yield enhancement, or profit rate, of GCC sovereign debt and sukuk relative to government-guaranteed debt of developed countries. Additionally, foreign investors find a compelling investment case in GCC members' high-grade credit ratings, large pools of capital savings (sovereign wealth funds), and relatively low debt-to-GDP profiles in conjunction with their enormous hydrocarbon reserves. Essentially, during the oil crisis of 2014-2016, the GCC was facing a cash flow timing issue, not a capacity-to-pay issue.
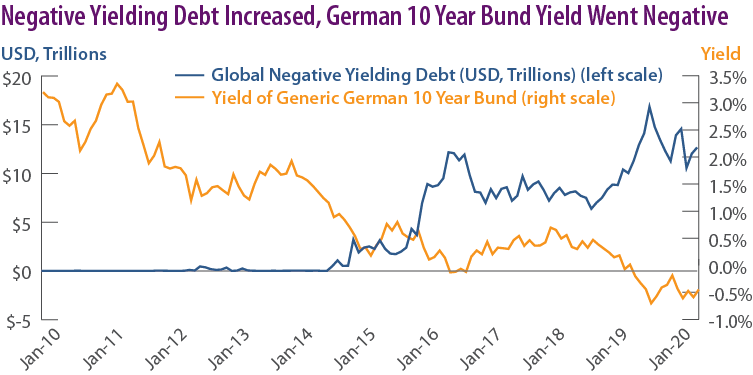
What helped bring about the strong foreign investor interest to GCC-issued debt and sukuk? After the Global Financial Crisis (GFC), investors faced historically, and now unprecedented, low interest rates following extraordinary measures taken by central banks to stimulate economic growth and stabilize the worlds' economies. One of the by-products of central bank measures has been negative-yielding interest rates. At year-end 2019, negative-yielding debt exceeded $11.2 trillion, down from its apex of $17.0 trillion back in August of 2019. At year-end 2019, the 10-year German government bund yield fell to a negative yield of -0.71%.
Low interest rates put investors in a difficult position to find income amid a "yield famine. " Central banks' policy actions create dislocations in the market that have distorted traditional risk and return rationales. Historically, investors have associated low yields with "safer" high-grade bonds, and high yields with lower rated bonds. Under current conditions, it's not uncommon to see US Treasury yields higher than those from Greece, a country whose debt crisis not long ago threatened the very stability of the European Union.
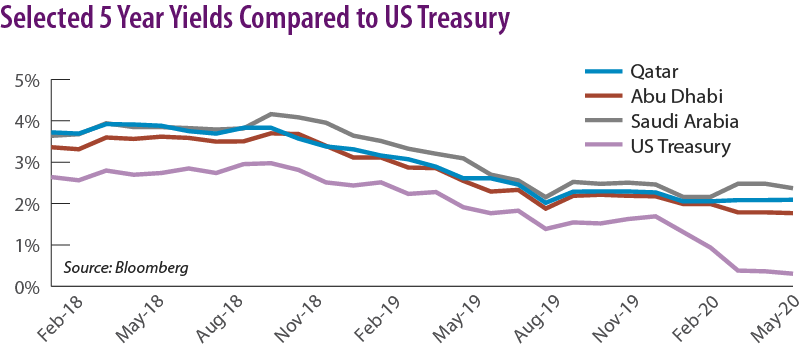
GCC debt and sukuk provide investors an appealing alternative and meaningful yield enhancement. For example, the average yield enhancement of Saudi Arabian five-year sovereign debt and sukuk from February 2018 until February 2020 was 103 basis points above the five-year US Treasury note. For the same maturity, Qatar's and Abu Dhabi's sovereign debt and sukuk provided an 85 basis point and 69 basis point yield enhancement to US Treasurys, respectively.
Further, many of the GCC members hold credit ratings that typically are found only among developed countries. S&P rates Abu Dhabi sovereign debt and sukuk credit at AA, followed by Qatar at AA-, and Saudi Arabia at A-. By comparison, S&P rates the US and the United Kingdom AA+, with China earning an A+.10
In the wake of the recent COVID-19 pandemic, central banks from around the world have engaged in further extraordinary accommodative measures in an effort to stabilize financial markets. The long-term impacts of these policies are far from being understood; however, it is clear that global interest rates will be lower for a lot longer. This will likely only further promote continued investor interest in the GCC region.
We note that the GCC community is characterized as a US-dollar based economy even though each of the GCC members retain their own local currency. Since hydrocarbon exports and imports are primarily paid in US dollars, the GCC members have pegged their local currency to the US dollar. Retaining a US-dollar pegged currency requires the governments of the region to adjust their interest rate policies in tandem with the Federal Reserve's interest rate policies. As such, GCC liabilities, fiscal budgets, government receipts, and assets become a US-dollar denominated proxies, which helps them avoid currency mismatches – a situation where a country's assets are denominated in their local currency, such as the Saudi riyal, while having their liabilities and obligations payable in another currency, such as the US dollar. Foreign investors find this attractive as it helps them to potentially side-step adverse currency devaluations on their investments.
Plenty in the Bank and Plenty in the Tank
Plenty in the Bank
The GCC region's high investment-grade credit ratings, in part, reflect the collective members' large capital and hydrocarbon reserves. In 1938, Saudi Arabia commenced commercial production from its first oil well, Damman No. 7, aptly nicknamed the "Prosperity Well."11 Over the subsequent eight decades, Saudi Arabia and its GCC members became a major supplier of the world's insatiable energy needs. By 2018, GCC members satisfied 23.8% of the world's market share of oil.12 The byproduct of this multidecade endeavor was enormous wealth in the GCC region, giving uncanny credence to the first oil well's nickname.
Scroll right to see more »
| Ranking of Sovereign Wealth Funds | |||||
| Rank | Sovereign Wealth Fund | ($ billions) | Country | ||
| 1 | Norway Government Pension Fund Global | $1,058.05 | Norway | ||
| 2 | China Investment Corporation | $941.40 | China | ||
| 3 | Abu Dhabi Investment Authority | $683.00 | UAE | ||
| 4 | Kuwait Investment Authority | $592.00 | Kuwait | ||
| 5 | Hong Kong Monetary Authority Investment Portfolio | $522.60 | Hong Kong | ||
| 6 | SAMA Foreign Holdings | $515.60 | Saudi Arabia | ||
| 7 | SAFE Investment Company | $441.00 | China | ||
| 8 | Gov't of Singapore Investment Corporation | $390.00 | Singapore | ||
| 9 | Temasek Holdings | $375.00 | Singapore | ||
| 10 | Public Investment Fund | $360.00 | Saudi Arabia | ||
| 11 | Qatar Investment Authority | $320.00 | Qatar | ||
| 12 | National Social Security Fund | $295.00 | China | ||
| 13 | Investment Corporation of Dubai | $339.80 | UAE | ||
| 14 | Mubadala Investment Company | $226.00 | UAE | ||
| 15 | Korea Investment Corporation | $134.10 | South Korea | ||
| Total | $7,193.55 | ||||
| Middle East Representation | $3,036.40 | 42.20% | |||
| Source: Bloomberg | |||||
Scroll right to see more »
In August of 2018, the GCC had amassed such collective wealth that seven of its sovereign wealth funds control 42%, $3.0 trillion, of the total $7.19 trillion of assets held among the top 15 sovereign wealth funds.13 If expressed on a per capita basis, the size of the GCC region's concentrated wealth is unmatched when compared to most developed nations.
Not all of the GCC's sovereign wealth is allocated for immediate use; some is dedicated for future use. For example, Kuwait's Future Generations Fund, an intergenerational savings fund, permits no asset withdrawals unless sanctioned by law.14 The only time that proceeds were withdrawn from the FGF was in conjunction with the 1990-91 Iraqi invasion and occupation. From 1990 through 1994, nearly $85 billion in assets were withdrawn to pay for the cost of liberation and subsequent reconstruction and were later fully repaid.15
Despite these self-imposed internal regulations on the allocation and use of their respective sovereign wealth funds, the GCC region has the capacity, if elected, to tap these tremendous capital resources.
| Ratio ($ / person) | |
| Norway | $194,437.62 |
| Kuwait | $139,406.89 |
| Qatar | $132,474.07 |
| UAE | $128,903.77 |
| Singapore | $128,767.83 |
| Saudi Arabia | $25,875.60 |
| South Korea | $2,625.36 |
| China | $1,199.36 |
| Source: Bloomberg | |
Plenty in the Tank
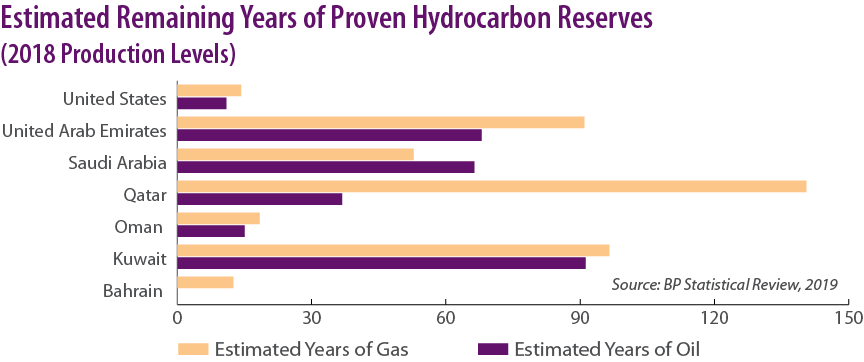
The transition toward a clean energy economy will likely take decades. Until then, the GCC region is extremely well endowed with hydrocarbon reserves.16 For example, based on 2018 production rates, Qatar's gas reserves are projected to last 140.5 years, Kuwait's to last 96.5 years, and the UAE's 90.9 years. Kuwait's oil reserves are estimated to last 91.2 years, followed by UAE with 67.9 years, and Saudi Arabia with 66.3 years.
Adding to these enormous hydrocarbon reserves, the region is still discovering vast energy deposits, potentially extending the timeline for many of the GCC members. On March 20, 2018, Oman announced the discovery of a four trillion cubic foot gas reservoir.17 In 2018 Bahrain announced discovery of hydrocarbon deposits estimated at 80 billion barrels of oil and between 10 and 20 trillion cubic feet of deep natural gas.18 If Bahrain's announcement proves accurate, the smallest GCC member as measured by land size, will have a hydrocarbon reservoir that matches Russia's entire oil reserves.19 On February 3, 2020, the UAE announced the discovery of a natural gas field containing 80 trillion standard cubic feet of gas between Abu Dhabi and Dubai.20
While production on these new hydrocarbon reserves will take some time, particularly in light of oil's dramatic price decline during the first half of 2020, these new discoveries will help the GCC region retain its role as the world's energy supply epicenter. This, in turn, will help the GCC to meet its ongoing fiscal needs.
GCC's Indebtedness versus the Developed World
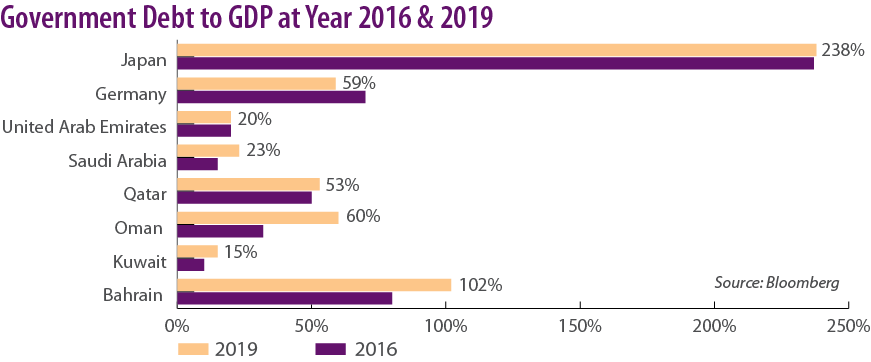
The GCC members' lower indebtedness in conjunction with favorable yield enhancements and strong credit ratings are among some of the many attributes that are attracting investors to the region. When Abu Dhabi issued its debt back in April 2016, it wasn't just the attractive yields and favorable AA credit ratings that tantalized investors, it was also the emirate's low outstanding debt. With the exception of Bahrain and Oman, which retain a below-investment-grade credit status, the GCC members' debt-to-GDP ratio is extremely low. Low debt affords a country greater financial flexibility than a highly leveraged country to meet its ongoing financial debt and sukuk obligations. Some of the GCC members retain high credit ratings in addition to extremely low levels of debt as compared to substantially leveraged developed countries, such as Japan whose year-end debt-to-GDP was 236% in 2016 and 238% in 2019.21 S&P rates Japan's credit A+.22
The Price of Oil and the Sukuk Market: Understanding the Relationship
There are several characteristics of sukuk that help insulate investors from short-term oil price shocks. These include the type of sukuk structure, the behavior of sukuk relative to other asset classes, their industry exposures, and the issuer's underlying credit quality. Over the interim to longer-term period, the price of oil can adversely affect an issuer's credit profile, particularly with those issues directly tied to the energy sector. However, it is not an overnight matter.
The Importance of Structure
To be considered halal, sukuk must conform to Islamic investing principles. The Accounting and Auditing Organization for Islamic Financial Institutions (AAOIFI) defines this as the investment certificate itself must represent "undivided shares in ownership of tangible assets, usufruct and services or (in the ownership of) the assets of [a] particular project or special investment activity."23 This requires the certificate's structure to reflect a legal transfer of ownership of the underlying assets from the issuer to the investor, or in some cases a beneficial ownership is transferred.24 Payments to the certificate holders are based on the net profits of the underlying assets. The issuer cannot guarantee the security's investment return, such as a coupon rate (often referred to as the sharia-compliant profit rate), or establish a predetermined price, such as a principal value, at the end of the investment certificate's tenure; hence establishing a true risk-return relationship.
Islamic investment certificates' underlying tangible assets — and the expectation of steady income from them — can help reduce short-term price volatility relative to energy commodities and other asset classes, such as the broader equity and bond markets. The result is that Islamic-compliant investment certificates typically have a significant asset-backed component as part of their underlying investment structure. The assets could be equipment, real estate, infrastructure, or other operating assets, such as a dock. Sukuk al-ijara, for example, are typically structured as an asset-backed lease.
In contrast, conventional bondholders receive cash flows that are independent of the amount of profit or loss earned from the funds raised through issuing bonds. Unlike shareholders, bondholders receive income that has been determined and agreed upon in advance. As a result, creditors avoid direct exposure to the uncertainties, or risks, of the underlying assets or business enterprise. Rather, their risk is tied to the creditworthiness of the issuer. In other words, creditors do not directly share the risks faced by the enterprise they finance. It is for this reason that interest-based bonds are "risk-transferring" rather than "risk-sharing" contracts.25 Furthermore, sukuk investors may obtain a higher value at the end of the investment certificate's tenure if the market value of the security's underlying asset or business enterprise appreciates. Bondholders receive only the return of their original principal, or par value, upon the security's maturity.
Sukuk vs. Crude Oil and Conventional Fixed Income
How sukuk correlate with other asset classes contributes to understanding of their risk and return characteristics. The FTSE Sukuk Index's five-year price correlation to crude oil prices as represented by the WTI is 0.367. Stated differently, 36.7% of the price movement of the FTSE Sukuk Index can be explained by crude oil prices. Conventional fixed income benchmarks offer a more meaningful description of the risk and return characteristics of the FTSE Sukuk Index. For example, the J.P. Morgan Emerging Market Bond Index (J.P. Morgan EMBI) provides the highest correlation at 0.856, followed by the Bloomberg Barclays US Aggregate Total Return Unhedged USD (BB-USAGG) benchmark at 0.704.
Scroll right to see more »
| 5 Year Correlation Matrix (March 31, 2015 – March 31, 2020; Weekly Data) | ||||||
| Asset Class | Crude Oil (WTI) | FTSE Sukuk | Bloomberg Barclays US Aggregate | J.P. Morgan EMBI Global Core | MSCI ACWI | S&P 500 |
| Crude Oil (WTI) | 1.000 | 0.367 | 0.048 | 0.468 | 0.529 | 0.486 |
| FTSE Sukuk | 0.367 | 1.000 | 0.704 | 0.856 | 0.503 | 0.448 |
| Bloomberg Barclays Aggregate | 0.048 | 0.704 | 1.000 | 0.621 | 0.156 | 0.107 |
| J.P. Morgan EMBI Global Core | 0.468 | 0.856 | 0.621 | 1.000 | 0.711 | 0.632 |
| MSCI ACWI Index | 0.529 | 0.503 | 0.156 | 0.711 | 1.000 | 0.959 |
| S&P 500 | 0.486 | 0.448 | 0.107 | 0.632 | 0.959 | 1.000 |
| Source: Bloomberg | ||||||
Scroll right to see more »
In September of 2018, J.P. Morgan formally announced its plans to include GCC bonds and sukuk in its EMBI benchmark.26,27 As of October 2018, GCC debt and sukuk represented 11.2% of J.P. Morgan's EMBI Index.28 At the time of J.P. Morgan's announcement, market analysts anticipated that upwards of $60 billion in new investor flows could arrive to the region causing spreads to tighten by 10-15 basis points.29 This meant that increased demand would most likely bid up the price of the securities causing the yield (profit) spread to narrow.
The byproduct of such a large increase in demand for GCC debt and sukuk means that sukuk benchmarks, such as the FTSE Sukuk Index, will begin to exhibit greater correlation with that of broadly held emerging market benchmarks that are denominated in US dollars. Prior to GCC inclusion, from the end of the first quarter of 2013 through the first quarter of 2018, the correlations of the FTSE Sukuk Index to the J.P. Morgan EMBI benchmark and the BB-USAGG benchmark were 0.413 and 0.561, respectively.
Scroll right to see more »
| 5 Year Correlation Matrix (March 29, 2013 - March 31, 2018; Weekly Data) | ||||||
| Asset Class | Crude Oil (WTI) | FTSE Sukuk | Bloomberg Barclays US Aggregate | J.P. Morgan EMBI Global Core | MSCI ACWI | S&P 500 |
| Crude Oil (WTI) | 1.000 | 0.100 | -0.161 | 0.237 | 0.350 | 0.275 |
| FTSE Sukuk | 0.100 | 1.000 | 0.413 | 0.561 | 0.304 | 0.208 |
| Bloomberg Barclays Aggregate | -0.161 | 0.413 | 1.000 | 0.480 | -0.062 | -0.152 |
| J.P. Morgan EMBI Global Core | 0.237 | 0.561 | 0.480 | 1.000 | 0.544 | 0.408 |
| MSCI ACWI Index | 0.350 | 0.304 | -0.062 | 0.544 | 1.000 | 0.937 |
| S&P 500 | 0.275 | 0.208 | -0.152 | 0.408 | 0.937 | 1.000 |
| Source: Bloomberg | ||||||
Scroll right to see more »
The correlation between the FTSE Sukuk Index and the WTI also rose from 0.10 for the five-year period ended March 29, 2018, to 0.367 for the five-year period ended on March 31, 2020. Some of this correlation drift can be explained, in part, by the price of oil increasing from $64.94 at the end of the first quarter of 2018 to $73.25 at the end of the third quarter. Despite falling back in the mid-$50 to $60 range throughout 2019, financial assets remained supportive to help improve the correlation characteristics of FTSE Sukuk with the WTI.
A Look Back in History: Oil's Previous Price Decline and the FTSE Sukuk Index
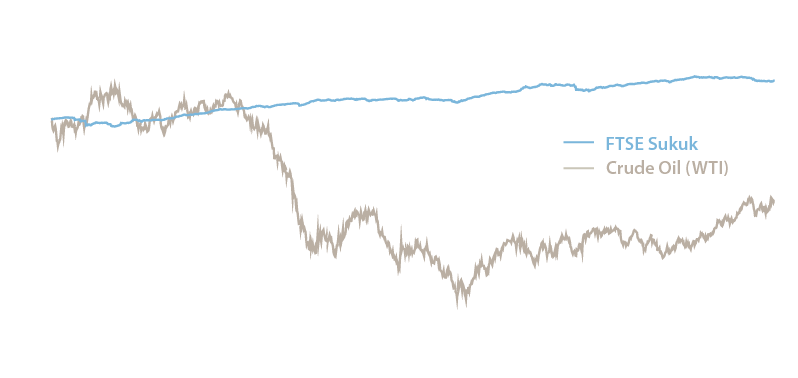
We have observed periods when the price of oil declined while the FTSE Sukuk Index increased. For example, when oil plunged from a high of $107.26 a barrel on June 20, 2014, to $26.21 on February 11, 2015, the FTSE Sukuk Index continued to demonstrate favorable appreciation. From March 30, 2013, through March 30, 2018, the FTSE Sukuk Index rose while oil prices dropped and subsequently climbed back up.
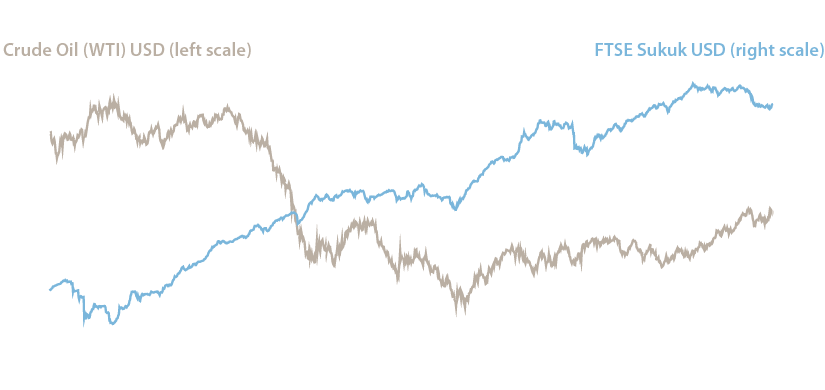
During that period, the WTI's total return was -33.21% compared to the FTSE Sukuk Index's 15.80% total return, representing annualized returns of -7.75% and 2.97%, respectively. We note that past performance does not indicate any assurance of future performance. However, the objective is to show that sukuk performance has not followed the return characteristics of oil in a lockstep manner, but rather a more complex interrelationship exists.
Putting a Pin in Relative Risk and Return
While the GCC sukuk market has grown rapidly in recent years, it remains a nascent market subject to multiple externalities, such as oil price shocks, regional tensions, fickle foreign institutional flows, and a host of other factors. Despite some of these characteristics, the GCC debt and sukuk market has been demonstrating favorable enough risk and return attributes to warrant long-term investors' consideration. For example, when comparing various regional and broad-based fixed-income benchmarks, the Bloomberg Barclays GCC Credit Total Index Unhedged USD and the FTSE Sukuk Index demonstrate competitive performance over five-year, three-year, and one-year trailing periods, as well as for the first quarter of 2020.
Scroll right to see more »
| Benchmarks | 5-year Trailing Return | 3-year Trailing Return | ||
| (3/31/15-3/31/20) | (3/31/17-3/31/20) | |||
| Annualized | Total Return | Annualized | Total Return | |
| Bloomberg Barclays GCC Credit Total Return Index Value Unhedged USD | 18.09% | 3.38% | 11.60% | 3.72% |
| Bloomberg Barclay's EM Asia USD Total Return Index Value Unhedged | 19.48% | 3.62% | 9.88% | 3.19% |
| Bloomberg Barclay's EM Hard Currency Agg. TR Index Value Unhedged USD | 16.28% | 3.06% | 4.46% | 1.46% |
| J.P. Morgan EMBI Global Core | 14.17% | 2.68% | 0.95% | 0.32% |
| FTSE Sukuk | 16.45% | 3.09% | 9.89% | 3.10% |
| Bloomberg Barclays US Treasury Index measures | 19.60% | 3.64% | 18.51% | 5.82% |
| Bloomberg Barclays Global Agg Treasuries Total Return Index | 15.07% | 2.84% | 12.08% | 3.87% |
| Bloomberg Barclays US Agg Total Return | 17.96% | 3.35% | 15.10% | 4.82% |
| S&P 500 | 38.41% | 6.71% | 16.08% | 5.09% |
| MSCI Emerging Markets Index | 0.10% | 0.02% | -3.81% | -1.29% |
| Crude Oil (WTI) | -56.97% | -15.51% | -59.53% | -26.01% |
| Source: Bloomberg | ||||
Scroll right to see more »
While returns can be an important part of an investor's equation, risk should also be considered. Standard deviation measures the amount of variation, or dispersion, of a set of values and is commonly used to measure investment risk. In this case, the set of values comprises investment returns over a period of time, such as over five and three years. The higher the standard deviation, the greater the dispersion of returns – both positive and negative. Greater return dispersion implies greater risk while, conversely, the lower the dispersion, the lower the risk. It is worth adding that standard deviation is best used in a relative framework to compare returns to other asset classes and therefore gain a sense of return variability.
In examining the five-year standard deviation among a broad range of asset class benchmarks we are in a better position to gain a sense of risk. The WTI has the highest standard deviation, at 37.1%, among all the asset classes, followed by the the MSCI Emerging Market equity index at 18.1%, and the S&P 500 equity index at 16.4%. The standard deviation of the FTSE Sukuk Index over the five and three-year period is the lowest among all the benchmarks, coming in at 2.9% and 3.3%, respectively.
Scroll right to see more »
| Benchmarks | 5-year Time Period | 3-year Time Period | ||
| (3/31/15-3/31/20) | (3/31/17-3/31/20) | |||
| Standard Deviation | Risk Factor Relative to FTSE Sukuk | Standard Deviation | Risk Factor Relative to FTSE Sukuk | |
| Bloomberg Barclays GCC Credit Total Return Index Value Unhedged USD | 5.2% | 1.8 | 6.3% | 1.9 |
| Bloomberg Barclay's EM Asia USD Total Return Index Value Unhedged | 4.0% | 1.4 | 4.5% | 1.4 |
| Bloomberg Barclay's EM Hard Currency Agg. TR Index Value Unhedged USD | 6.3% | 2.2 | 7.2% | 2.2 |
| J.P. Morgan EMBI Global Core | 8.8% | 3.0 | 10.2% | 3.1 |
| FTSE Sukuk | 2.9% | 1.0 | 3.3% | 1.0 |
| Bloomberg Barclays US Treasury Index measures | 4.2% | 1.5 | 4.3% | 1.3 |
| Bloomberg Barclays Global Agg Treasuries Total Return Index | 6.7% | 2.3 | 6.0% | 1.8 |
| Bloomberg Barclays US Agg Total Return | 3.9% | 1.4 | 4.2% | 1.3 |
| S&P 500 | 16.4% | 5.7 | 18.7% | 5.7 |
| MSCI Emerging Markets Index | 18.1% | 6.3 | 17.7% | 5.7 |
| Crude Oil (WTI) | 37.1% | 12.9 | 37.0% | 11.2 |
| Source: Bloomberg | ||||
Scroll right to see more »
The data is relatively consistent over the five and three-year periods. We do not mean to imply that sukuk are not risky investments as this market is still relatively nascent and has unique risks that may not be entirely captured through standard deviation metrics. However, the data provide context of how this asset class has performed over intermediate and short-term periods relative to other asset classes during favorable as well as adverse financial conditions, including the first quarter of 2020.
Conclusion
As central banks and world governments pursue extraordinary measures in response to COVID-19, the expected "lower for longer" interest rate climate will help position the GCC not only as the world's supplier of energy but also as a possible source of yield for savvy investors. Backed by large hydrocarbon and financial reserves and relatively low debt-to-GDP profiles compared to the developed world economies, it is reasonable to expect investors will continue to have considerable interest in the region for some time. Over recent years, US-dollar denominated sukuk have offered a favorable risk and return profile while remaining relatively insulated from extreme oil price swings. The merits for these trends continue remain favorable but not assured.
The sukuk market has experienced substantial growth in a short period of time, with GCC members becoming the dominate issuers. Unique exogenous risk factors found in these markets do not exist in other emerging markets: GCC members are kingdom states that integrate sharia law. And, as with most emerging markets, these regions are susceptible to volatility associated with capricious foreign capital flows.
On balance, GCC US-dollar denominated sukuk provide investors a valuable means of diversification in a distinct asset class with unique and favorable risk and return attributes.
About the Author

Patrick Drum MBA, CPA®, CFP®
Senior Investment Analyst
Footnotes
1 IIFM Sukuk Report 2019, A Comprehensive Study of the Global Sukuk Market, 8th Edition, July 2019. https://www.iifm.net/sukuk-reports/
2 Ibid.
3 Upadhyay, Rakesh. How Realistic Is Saudi Arabia's $2 Trillion Sovereign Wealth Fund? Oilprice.com April 7, 2016. https://oilprice.com/Energy/Energy-General/How-Realistic-Is-Saudi-Arabias-2-Trillion-Sovereign-Wealth-Fund.html
4 Kassem, Mahmoud. Abu Dhabi raises $5bn from first bond sale in seven years, The National, April 26, 2016. https://www.thenational.ae/business/markets/abu-dhabi-raises-5bn-from-first-bond-sale-in-seven-years-1.142390
5 Abu Dhabi says to fund wider 2016 deficit mainly via bond issues, Reuters, April 24, 2016. https://www.reuters.com/article/abu-dhabi-bonds/abu-dhabi-says-to-fund-wider-2016-deficit-mainly-via-bond-issues-idUSL5N17R0E6
6 Abu Dhabi's $5-billion bonds heavily oversubscribed, Emirates 24/7, May 10, 2016. https://www.emirates247.com/business/economy-finance/abu-dhabi-s-5-billion-bonds-heavily-oversubscribed-2016-05-10-1.629695
7 What is the GCC? Al Jazeera News, December 4, 2017. https://www.aljazeera.com/news/2017/12/gcc-171204094537378.html
8 GCC Countries 2020, World Population Review. https://worldpopulationreview.com/countries/gcc-countries/
9 International Monetary Fund, World Economic Outlook Database, IMF.org. https://www.imf.org/external/pubs/ft/weo/2019/02/weodata/index.aspx
10TradingEconomics.com. https://tradingeconomics.com/country-list/rating
11 SaudiAramco.com, Our History. https://www.saudiaramco.com/en/who-we-are/overview/our-history#
12 Bloomberg: BI OILSN market share 2018
13 Largest Sovereign Wealth Funds, Reuters Graphics, ThomsonReuters.com. http://fingfx.thomsonreuters.com/gfx/rngs/GULF-QATAR-QIA/010041PS3P9/index.html
14 Kuwait Investment Authority, kia.gov.kw. https://kia.gov.kw/investments
15 Kuwait Investment Authority, KIA's Implementation of the Santiago Principles, IFSWF Case Study, Three Pillar Format, October 18, 2018. https://kia.gov.kw/wp-content/uploads/2018/10/KIA-IFSWF-CASE-STUDY-Presentation-18OCT2018-V2-1.pdf
16 Statistical Review of World Energy, British Petroleum, BP.com. https://www.bp.com/en/global/corporate/energy-economics/statistical-review-of-world-energy/downloads.html
17 Ellyatt, Holly. Bahrain is betting on 80 billion barrels of oil to help clear its budget deficit, CNBC, May 8, 2018. https://www.middleeastmonitor.com/20180320-oman-announces-discovery-of-4-trillion-cubic-feet-gas-reservoir/
18 Ibid.
19 Barbuscia, Davide. Energy minnow Bahrain just found 80 billion barrels of oil, as much as Russia's entire reserve, Financial Post, April 5, 2018. https://business.financialpost.com/commodities/energy/update-2-bahrain-says-new-discovery-contains-an-estimated-80-bln-barrels-of-tight-oil
20 UAE finds new natural gas field between Abu Dhabi, Dubai, Al Jazeera, February 3, 2020. https://www.aljazeera.com/ajimpact/uae-finds-natural-gas-field-abu-dhabi-dubai-200203120215449.html
21 International Monetary Fund, World Economic Outlook Database, Report for Selected Countries and Subjects. omf.org. https://www.imf.org/external/pubs/ft/weo/2019/02/weodata/weorept.aspx
22 Japan Credit Rating, WorldGovernmentBonds.com. http://www.worldgovernmentbonds.com/credit-rating/japan/
22 The Sukuk Handbook, A Guide To Structuring Sukuk, Second Edition, Latham & Watkins. https://www.lw.com/thoughtLeadership/guide-to-structurings-sukuk
24 Zaharuddin Zakaria, M, Zaki Salleh, A, Zaity Abdul Aziz, A. The Application of Beneficial Ownership in Asset-Based Sukuk: A Sharinah Analysis, Malaysian Journal of Syariah and Law, Vol. 3, December 2016. http://ddms.usim.edu.my/bitstream/123456789/16313/1/2-1-2-1-10-20170710.pdf
25 Kamali, M.H., Abdullah, A.K., editors. Islamic Finance: Issues in Sukuk and Proposals for Reform, Chapter 4, Sukuk and Bonds: A Comparison, 2014.
26 Barbuscia, Davide. Saudi Arabia, four other Gulf states to enter key JP Morgan bond indexes, ThomsonReuters, September 26, 2018. https://www.reuters.com/article/us-gulf-bonds-jpmorgan/saudi-arabia-four-other-gulf-states-to-enter-key-jp-morgan-bond-indexes-idUSKCN1M61HZ
37 Roscoe, Andrew. Five GCC states to enter JP Morgan emerging market bond index, MEED, September 30, 2018. https://www.meed.com/five-gcc-states-enter-jp-morgan-emerging-market-bond-index/
28 Carter, L. Bryan. Is Now A Good Time To Look At Emerging Market Debt? BNP Paribas Asset Management presentation, Slide 12, October 2018. https://www.dertreasurer.de/fileadmin/PDF/Roundtables/Frankfurt_am_Main_30._Oktober_2018/Carter_Bryan_BNP_Paribas.pdf
29 Suresh Mayenkar, Siddesh. GCC inclusion in JP Morgan EM bond index to attract $60b, Gulf News, September 26, 2018. https://gulfnews.com/business/markets/gcc-inclusion-in-jp-morgan-em-bond-index-to-attract-60b-1.2283069
Important Disclaimers
This material is for general information only and is not a research report or commentary on any investment products offered by Saturna Sdn Bhd. This material should not be construed as an offer to sell or the solicitation of an offer to buy any security in any jurisdiction where such an offer or solicitation would be illegal. To the extent that it includes references to securities, those references do not constitute a recommendation to buy, sell, or hold such security, and the information may not be current. Accounts managed by Saturna Sdn Bhd may or may not hold the securities discussed in this material.
We do not provide tax, accounting, or legal advice to our clients, and all investors are advised to consult with their tax, accounting, or legal advisers regarding any potential investment. Investors should not assume that investments in the securities and/or sectors described were or will be profitable. This document is prepared based on information Saturna Sdn Bhd deems reliable; however, Saturna Sdn Bhd does not warrant the accuracy or completeness of the information. Investors should consult with a financial adviser prior to making an investment decision. The views and information discussed in this commentary are at a specific point in time, are subject to change, and may not reflect the views of the firm as a whole.
All material presented in this publication, unless specifically indicated otherwise, is under copyright to Saturna. No part of this publication may be altered in any way, copied, or distributed without the prior express written permission of Saturna.
A Few Words About Risk
The Amana Funds limit the securities they purchase to those consistent with Islamic and sustainable principles. The Saturna Sustainable Funds limit the securities they purchase to those consistent with sustainable principles. This limits opportunities and may affect performance. Fund share prices, yields, and total returns will change with market fluctuations as well as the fortunes of the countries, industries, and companies in which it invests. Foreign investing involves risks not normally associated with investing solely in US securities. These include fluctuations in currency exchange rates, less public information about securities, less governmental market supervision and the lack of uniform financial, social, and political standards. Foreign investing heightens the risk of confiscatory taxation, seizure or nationalization of assets, establishment of currency controls, or adverse political or social developments that affect investments.
The Amana Participation Fund is currently the only Amana Fund that invests in sukuk. While the Participation Fund does not invest in conventional bonds, risks similar to those of conventional nondiversified fixed-income funds apply. These include: diversification and concentration risk, liquidity risk, interest rate risk, credit risk, and high-yield risk. The Participation Fund also includes risks specific to investments in Islamic fixed-income instruments. The structural complexity of sukuk, along with the weak infrastructure of the sukuk market, increases risk. Compared to rights of conventional bondholders, holders of sukuk may have limited ability to pursue legal recourse to enforce the terms of the sukuk or to restructure the sukuk in order to seek recovery of principal. Sukuk are also subject to the risk that some Islamic scholars may deem certain sukuk as not meeting Islamic investment principles subsequent to the sukuk being issued.
While diversification does not guarantee against a loss in a declining market, it can help minimize the risk of the decline of a single market.